Setting up Tools and Content
Each MoLöwe project contains a Project Notebook. Here you can set up some of the MoLöwe tools using Python programming.
The required steps to achieve this are presented in this chapter.
(Note: Some MoLöwe tools do not need to be set up in the Project Notebook, see the Tools Chapter)
Although you will set up MoLöwe tools using Python, programming experience with Python is not required. This chapter is set up for users with no Python experience.
However, if you're experienced with Python and would like to explore more advanced applications, you can also check out the chapter for Advanced Users.
1 Acquiring the Project Notebook
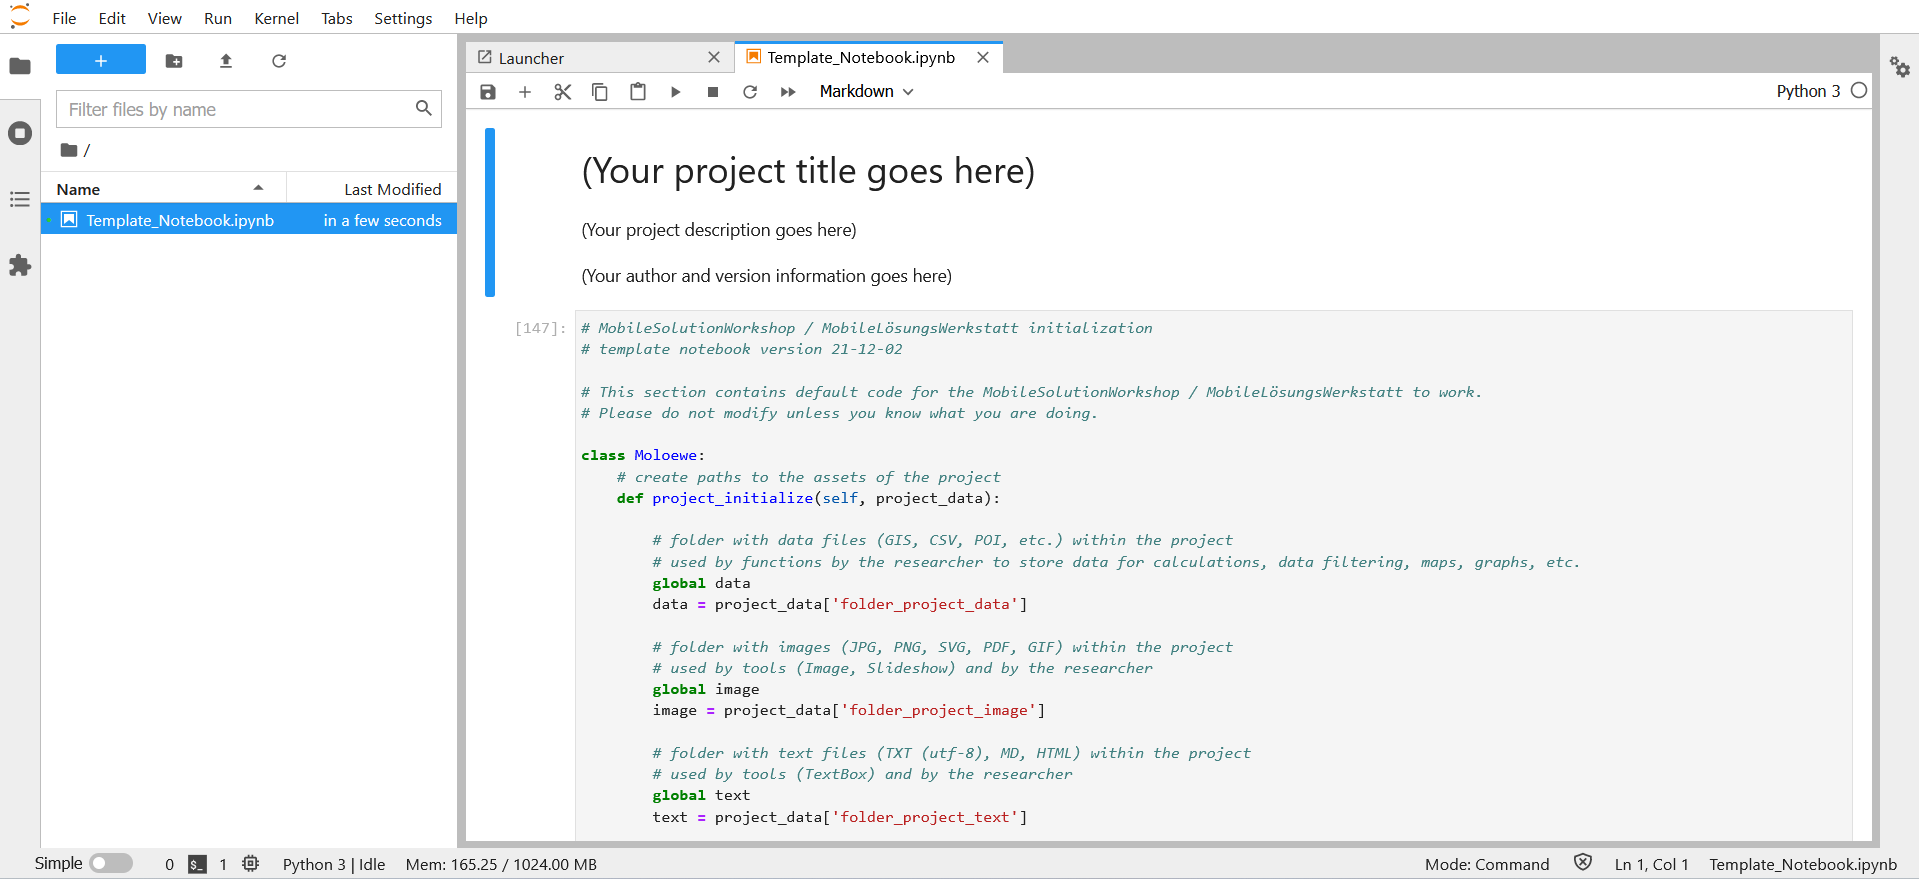
When a new MoLöwe project is created, a Project Notebook is automatically generated (named "Template Notebook"). Please go to your Project Page and download the Project Notebook from the Notebooks Subpage with the steps described here.
2 Accessing the Project Notebook
You can access the Project Notebook using JupyterHub. You have received a username and password for JupyterHub together with your MoLöwe user account.
You can open JupyterHub here.
Once you logged in to JupyterHub, please upload the Project Notebook by clicking the "Upload Files" button and choose the Project Notebook from your download folder.

Now open the Project Notebook by double-clicking on it in the left sidebar. The notebook will open in a new tab.
3 Structure of the Project Notebook
In order to make the Python code easier to read, the Project Notebook is arranged into cells. Each cell fulfills a specific task in the notebook.
For your purpose (setting up MoLöwe tools) only the following cells are relevant/need to be edited:
Preparatory code:
- Import modules
- Access Tokens and API Keys
- Global Variables, Constants, Settings
- Notebook Functions
Tool Code:
- Tool Switch
- Tool Dropdown
- Tool Button
- Tool Slider
- Tool Map
- Tool Graph
The following two sections will explain how these cells need to be edited in order to set up MoLöwe tools.
4 Preparatory code
In this section we will explain how the cells of the preparatory part of the Project Notebook need to be edited.
4.1 Import Modules
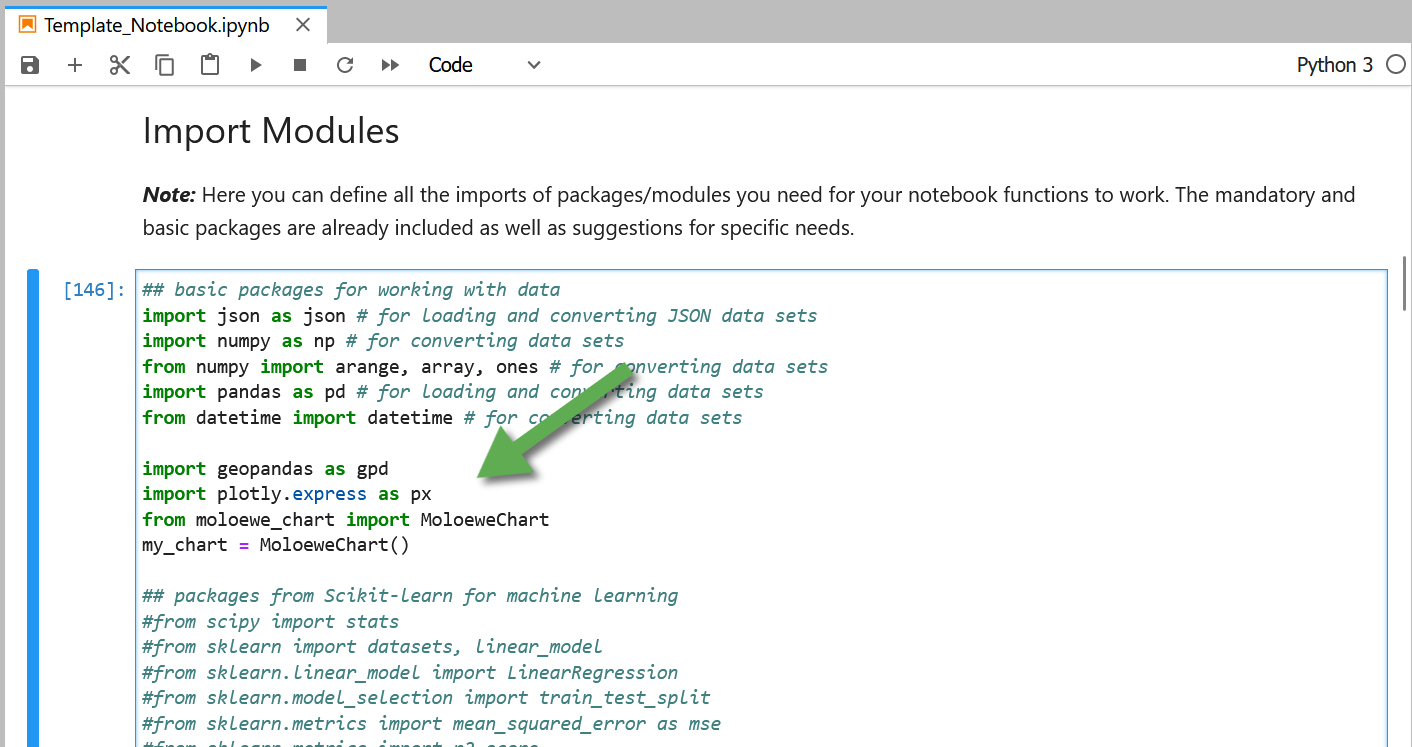
In the cell "Import Modules", please add the following two lines:
import geopandas as gpd
import plotly.express as px
from moloewe_chart import MoloeweChart
my_chart = MoloeweChart()
Like this:
4.2 Access Tokens and API Keys
The cell "Access Tokens and API Keys" needs to be edited if you want to show a map using mapbox.
Please see the chapter on Maps.
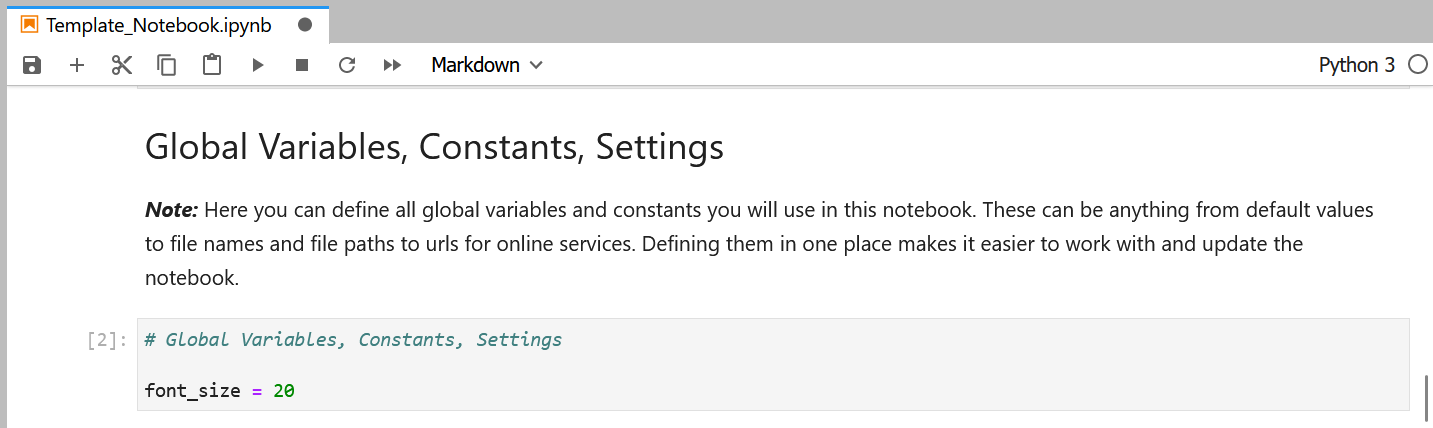
4.3 Global Variables, Constants, Settings
The cell "Global Variables, Constants, Settings" is different for every tool. Therefore, please refer to the specific to find out what code you exactly need here.
4.4 Notebook Functions
The cell "Notebook Functions" is different for every tool. Therefore, please refer to the specific to find out what code you exactly need here.
5 General Tool Code Structure
Before you jump into the individual tool codes, you should familiarize yourself with the general code structure of MoLöwe tools described in this section.
5.1 Where to Place Tool Codes
There are two options where to place the code of a tool.
5.1.1 Option 1: In the Respective Tool Class
The code of a tool can be placed in the cell that contains the respective tool class.
Example:
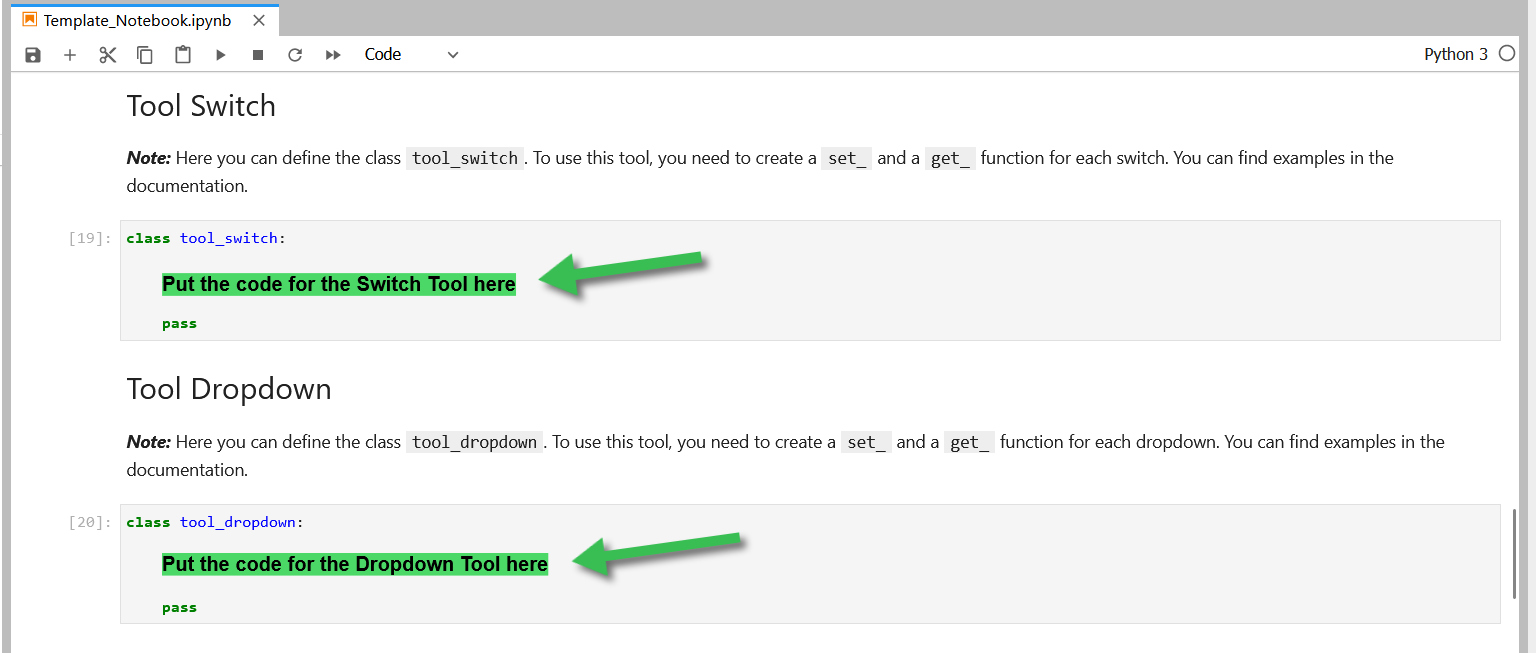
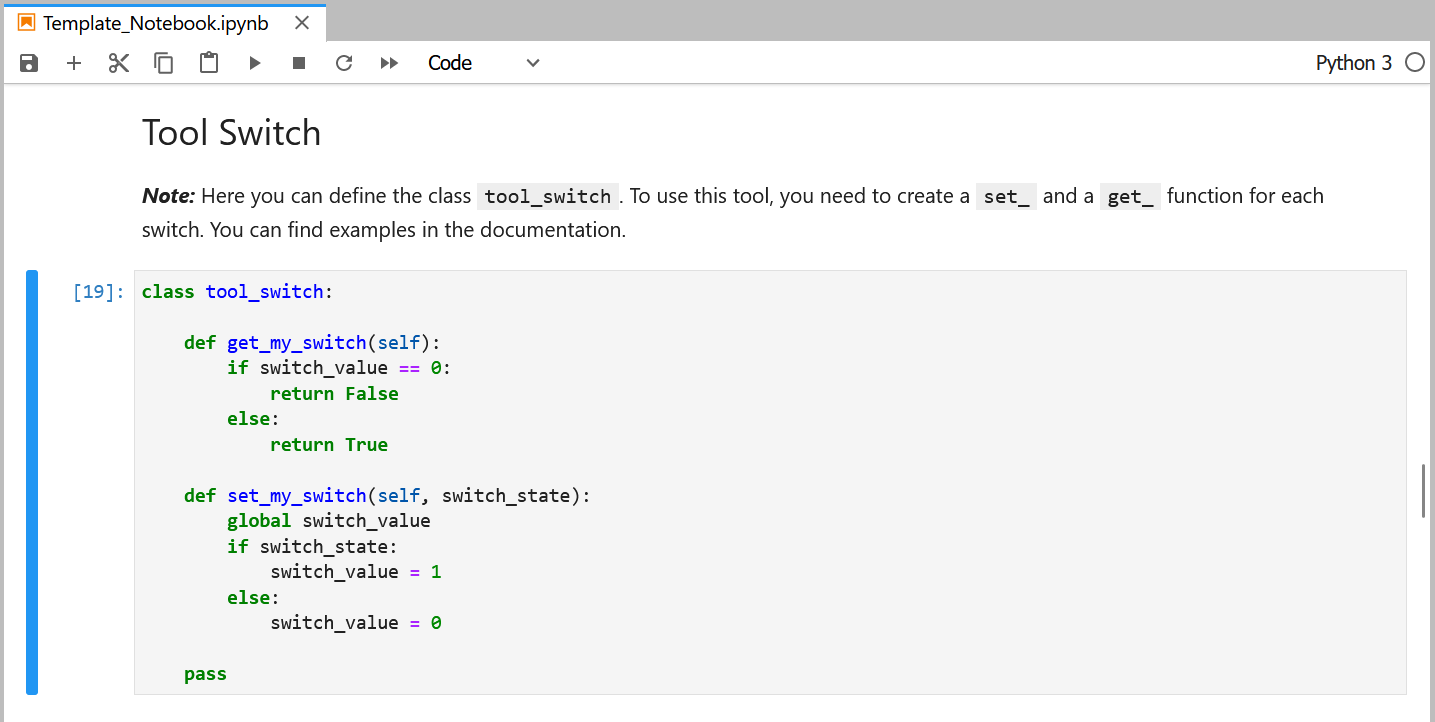
You would put the code for the Switch Tool in the cell "Tool Switch" beneath the line class tool_switch.
The code for the Dropdown Tool, on the other hand, belongs in the cell "Tool Dropdown" beneath the line class tool_dropdown.
Like this:
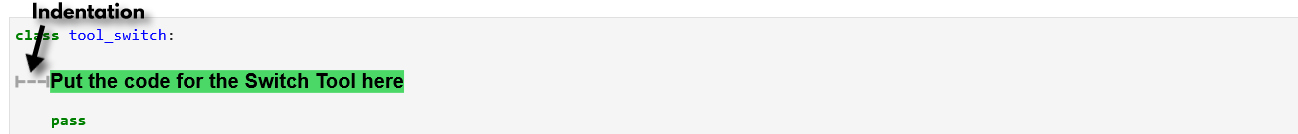
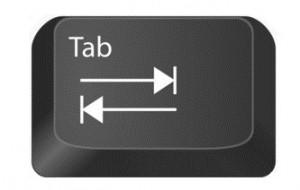
Be aware that your tool code needs to be indented. It needs to be on the same "level" as the line pass.
You can add an indentation with the Tab key on your keyboard.
If you want to create a second tool of the same kind, e.g. a second switch, you can place the code for the second switch right after the code of the first one.
5.1.2 Option 2: In a New Cell using "setattr()"
You can also create a new cell at the bottom of the Project Notebook and place the Tool code there. This option is preferable in more complex projects, where you have several Tools and/or several Tools of the same kind. It will make it easier to structure your Project Notebook in a comprehensible way.
To add a new cell, click the "+" sign in the options bar at the top of your Notebook. You can then add your Tool Code into the cell.
Beneath the Tool Code, you must add a "setattr()" function.
In the "setattr()" function, you need to add the following things:
- the class that the tool belongs to
- the name that should be displayed for the tool function when you add the tool to a slide
- the name of the tool function
You will learn more about tool functions later in this chapter.
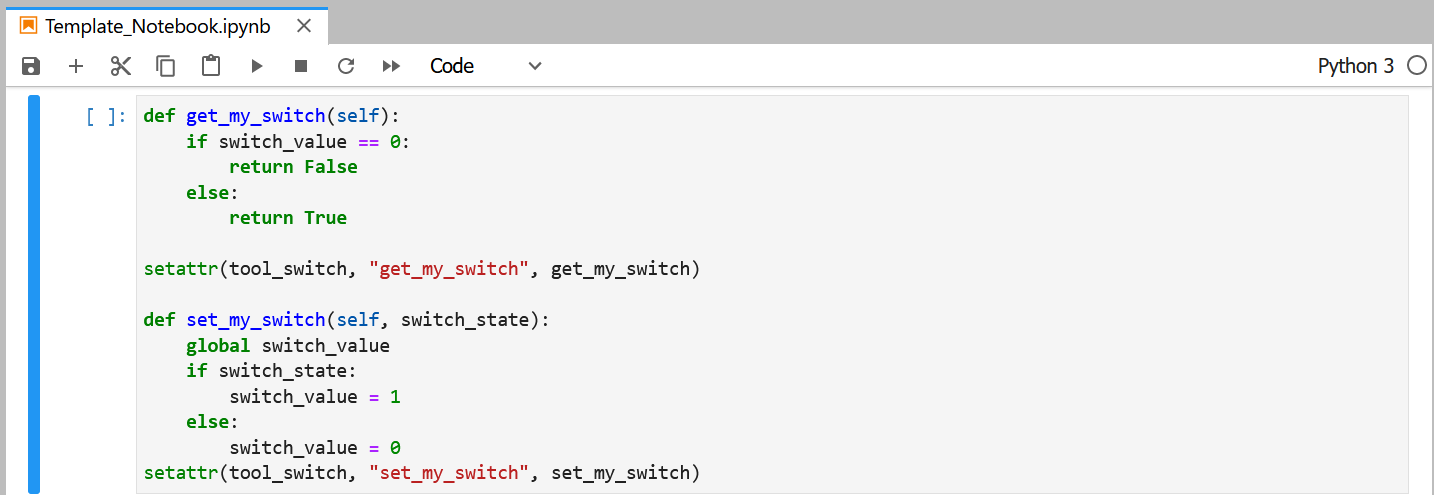
Here's an example for a get_ and set_ function of a Switch Tool (see Section 6.1):
def get_my_switch(self):
    if switch_value == 0:
        return False
    else:
        return True

setattr(tool_switch, "get_my_switch", get_my_switch)

def set_my_switch(self, switch_state):
    global switch_value
    if switch_state:
        switch_value = 1
    else:
        switch_value = 0

setattr(tool_switch, "set_my_switch", set_my_switch)
In the Project Notebook, it would look like this:
5.2 Accessing Files
Here we will show you how to access a file in the Project Notebook. You can access files that you've uploaded to MoLöwe beforehand or files from a URL.
For files that you've uploaded to MoLöwe beforehand, the file path needs to be prefixed by the project directory where the file comes from.
An overview of the respective project directories for each file type is shown here:
| File Extension | Project Directory | Description |
|---|---|---|
.PNG | /image | Image |
.JPG or .jpg | /image | Image |
.JPEG or .jpeg | /image | Image |
.MP4 or .mp4 | /video | Video file |
.txt | /text | Text file |
.md | /text | Markdown file |
.html or .HTML | /text | HTML file |
.shp, .shx, .prj and .dbf | /data | Shapefile extensions |
.csv | /data | CSV File |
Example 1:
You want to build a Graph from a csv file named my_data.csv (containing the respective data x- & y-data) that you've
uploaded to MoLöwe beforehand.
The code to read that file in a Project Notebook would be the following:
data_file = data + "my_data.csv"
You can then load the file into a Pandas DataFrame by using the code shown below:
df = pd.read_csv(data_file)
Now you can use the file to build a graph (see section 6.5)
Example 2:
The following example shows how to load data from a URL:
df = pd.read_csv(pd.read_csv("https://www.<link>.com/to/data/file.csv"))
As you can see, loading data from a URL quite straightforward.
The code to access a file must be in the tool code of the tool that will access the file! It cannot be in a different cell (Example: see Graph Tool Code in Section 6.5).
5.3 The get_ and set_ Function
MoLöwe tool codes are formulated as so-called functions.
Simply put, a function is a set of instructions that is executed when the function is called.
There are two functions that we need to define for a MoLöwe Tool: the get_ function and the set_ function.
5.3.1 The get_ Function
In the get_ function, we define the initial state of a tool, meaning its default parameters.
Example:
In the get_ function of the Dropdown Tool, you define which options should appear/are available
in the dropdown list and, in addition, which option will be selected by default (i.e. when you open the slide)
5.3.2 The set_ Function
In the set_ function, we define what happens when the tool is executed.
We can configure the set_ function in such a way that it changes a parameter value of another tool.
This is how we can set up interactions between tools.
Example:
Using the set_ function of a Button Tool, you can change the parameter displayed on the Y-Axis of a Graph Tool.
Naturally, some tools do not require both the get_ and the set_ function.
The Graph tool, for example, only needs the get_ function, containing the data you want to display in the graph.
The Button tool, on the other hand, only needs the set_ function, containing instructions on what to do when the button is pressed
(i.e. when its set_ function is called).
6 Tool Codes
Here we present the basic code for each tool. You can copy the code into your Project Notebook and adjust it to your needs.
Also, please see our User Examples (left sidebar).
6.1 Switch
The purpose of the Switch Tool is to change the value of a variable (i.e. parameter) from one to another.
In the following example, we create a Switch that changes the value of a variable from "0" to "1".
6.1.1 Global Variables, Constants, Settings
First, you need to define the variable that you want to change with the Switch Tool in the cell "Global Variables, Constants, Settings".
In this example, we have named the variable "switch_value" and given it the value "0".
switch_value = 0

You can use this variable in a Graph Tool and/or in a Map Tool and thus control the Graph/Map with the Switch Tool.
6.1.2 get_ Function
The get_ function of the Switch Tool defines if the default mode of the Switch should be "turned on" or "turned off".
If we want to translate that to Python, we need to define the Switch as "True" (for "turned on") or "False" (for "turned off").
To this end, the get_ function of the Switch Tool works with conditions.
Meaning, in order to define the default mode as "True" or "False", the get_ function checks the value of the
variable that we have defined in "Global Variables, Constants, Settings".
In our example, we want the default mode to be "turned off". We set up a condition that turns the Switch to "False" if the variable "switch_value" is "0". Since we initially defined "switch_value" as "0", the Switch will automatically be "False" i.e. "turned off" as default.
def get_my_switch(self):
    if switch_value == 0:
        return False
    else:
        return True

If you want the default mode of your Switch to be "turned on", you can replace "False" with "True".
def get_my_switch(self):
    if switch_value == 0:
        return True
    else:
        return False

6.1.2 set_ Function
The set_ function of the Switch Tool changes the value of a variable when the user presses the Switch.
In our example, the value of the variable "switch_value" is "0" when the Switch is "turned off" and changes to "1" if the Switch is "turned on".
def set_my_switch(self, switch_state):
    global switch_value
    if switch_state:
        switch_value = 1
    else:
        switch_value = 0
If we placed the get_ and the set_ function in the cell "Tool Switch" beneath the line class tool_switch it would
look like this:
An example with interaction between the Switch Tool and a Graph Tool is presented in the User Examples chapter here.
6.2 Dropdown
A Dropdown tool allows users to select a value from pre-defined options. Users can interact with the Dropdown tool by pressing on the tool to view all the dropdown list items and selecting an option from the list.
In the following example, we create a Dropdown tool that allows users to select a value of 10, 20, or 30.
6.2.1 Global Variables, Constants, Settings
First, a variable that stores the default value of the dropdown tool needs to be defined in the cell "Global Variables, Constants, Settings".
In the example below, the variable is named font_size and the "default" or "initial" value is 20.
font_size = 20
6.2.2 get_ Function
The get_ function is used to define the dropdown list options that are to be presented to the user and the
option that is selected by default.
def get_plot_font_size(self):
    return {
        "values": [10, 20, 30],
        "default": font_size
    }
6.2.3 set_ Function
The set_ function changes the value of font_size when a user makes a selection from the dropdown list.
def set_plot_font_size(self, dropdown_selection):
    global font_size
    font_size = dropdown_selection
If we placed the get_ and the set_ function in the cell "Tool Dropdown" beneath the line class tool_dropdown it would
look like this:
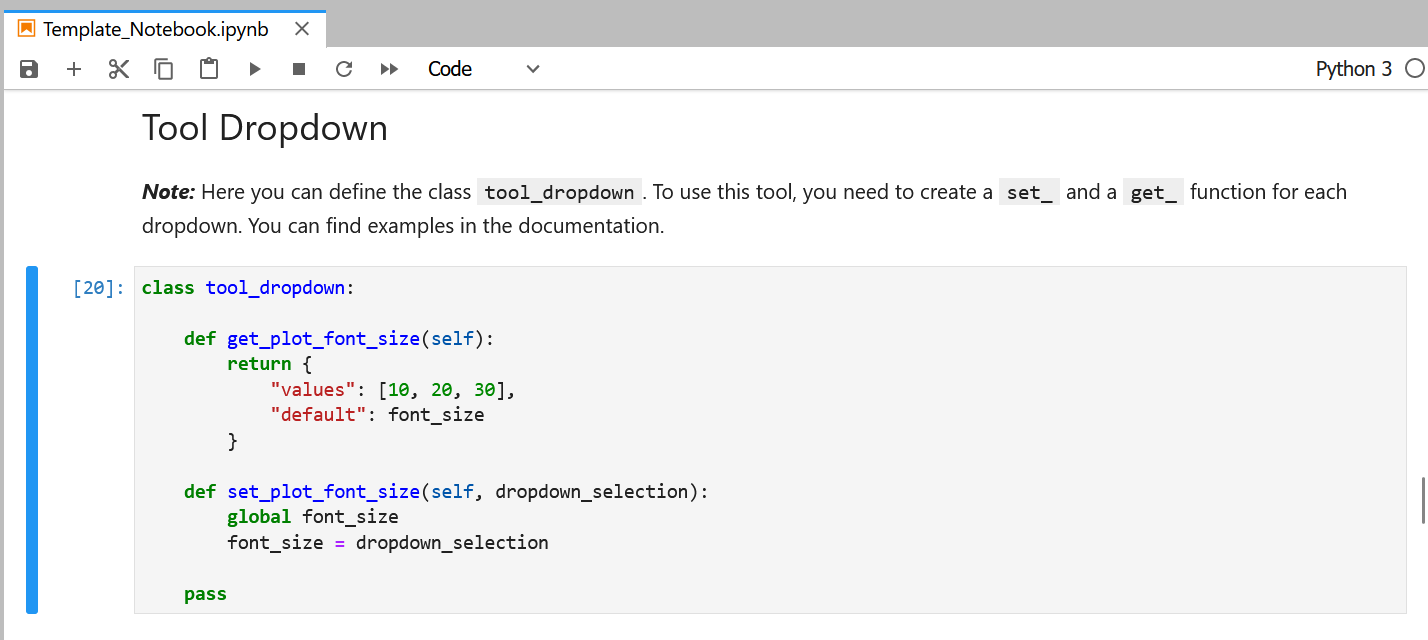
The variable "dropdown_selection" represent the dropdown selection made by the user.
Another example for the Dropdown Tool is presented in the User Examples chapter here.
6.3 Button
The Button Tool requires only a set_ function.
6.3.1 Example Scenario
An example function that needs to be defined in order to use this feature is presented below.
In this example, the variable whose value is being changed is stored_value which has 0 as its initial value.
The function set_to_one() is executed when the button is pressed to change the value stored in stored_value
from 0 to 1.
stored_value = 0
def set_to_one(self):
    global stored_value
    stored_value = 1
6.4 Slider
The Slider Tool requires both a get_ and a set_ function.
6.4.1 Example
We need a Slider Tool that allows users to select a value between 1 and 20. Additionally, only integer values are allowed. The selected values will be used to set the line width of a chart.
The code snippet below represents the entirety of code that needs to be written to create one Slider that allows users to select a value from a range between 1 and 20.
First, a global variable that stores a default value of the slider tool needs to be defined. In the example below,
the global variable is named line_width_1 and the "default" or "initial" value that it contains is 20.
As such, line_width_1 = 1 even when the user has not interacted with the slider tool at all.
Second, under the class tool_slider, a pair of get_ and set_ functions are defined. The get_ function is used
to define the slider options (minimum value, maximum value, and the step by which the value changes when user moves
the slider left or right) that are to be presented to the user when the user interacts with the Slider tool during a
presentation. Whereas, the set_ function is used by the system back-end to change value stored in the variable
line_width_1 when a user makes a selection using the slider. Note that the naming scheme between the get_ and
set_ functions are consistent as they both have the exact same name except the get_ and set_ prefixes.
line_width_1 = 1
class tool_slider:
    def get_plot_line_width_1(self):
        return {
            "Minimum": 1,
            "Maximum": 20,
            "Step": 1,
            "Default": line_width_1
        }

    def set_plot_line_width_1(self, slider_selection):
        global line_width_1
        line_width_1 = float(slider_selection)
The get_plot_line_width_1 function first calls the global variable line_width_1.
This way, the value stored in the global variable can be changed from within the local scope of the function.
Then, the function returns a dictionary with four key-value pairs as follows.
The first item in the dictionary is a key named Minimum, with the value mapped to it signifying the lowest value
that can be set using the slider. Likewise, the second item in the dictionary is a key named Maximum,
with the value mapped to it signifying the highest value that can be set using the slider.
The third item in the dictionary is a key named Step, which contains the value by which the number is
incremented when the slider is moved for just one step. The final item in the dictionary is a key named
Default which signifies the default value of the Slider tool when the tool has not been interacted with.
The value mapped to this key is the global variable line_width_1.
The set_plot_line_width_1 is used by the MoLöwe back-end to pass the selection made by a user with the Slider tool.
This function contains a keyword argument named slider_selection which is used by the MoLöwe back-end change the
value stored in the global variable line_width_1 (as can be seen in the code within the function).
Once the get_ and set_ functions have been defined, a Slider tool can be placed on a slide by opening the slide in Edit Mode.
If another slider tool is required for the presentation, say one that lets users change line width of a different line
in the plot, a new pair of get and set functions need to be defined under the class tool_slider as shown below:
line_width_1 = 1
line_width_2 = 7
class tool_slider:

    # first line
    def get_plot_line_width_1(self):
        return {
            "Minimum": 1,
            "Maximum": 20,
            "Step": 1,       # value increments by +/- 1
            "Default": line_width_1
        }

    def set_plot_line_width_1(self, slider_selection):
        global line_width_1
        line_width_1 = float(slider_selection)

    # second line
    def get_plot_line_width_2(self):
        return {
            "Minimum": 5,
            "Maximum": 15,
            "Step": 1.5,     # value increments by +/- 1.5
            "Default": line_width_2
        }

    def set_plot_line_width_2(self, slider_selection):
        global line_width_2
        line_width_2 = float(slider_selection)
6.5 Graph
The Graph Tool only requires a get_ function.
If you want to build a graph that is based on data in a file (e.g. text or csv), you must first upload that file to MoLöwe.
Example:
We want to create a line chart displaying Apple stock prices from 2014. We have uploaded a csv file ("apple_data.csv") with the stock prices to MoLöwe beforehand.
def get_apple_shares(self):

    df = pd.read_csv(data + 'apple_data.csv') # get the csv file

    fig = px.line(df, x = 'AAPL_x', y = 'AAPL_y', title='Apple Stock Prices over time (2014)')

    return my_chart.moloewe_chart_plot(plotly_data = fig.to_dict(), plotly_config=dict())
Users are referred to the official Plotly documentations for information on how to create Plotly charts.
6.6 Map
The Map Tool only requires a get_ function.
Many aspects of the way the Map Tool is set up bear resemblance to the Graph Tool. Hence, readers are advised to read the documentation on the Graph Tool to learn about the Map Tool.
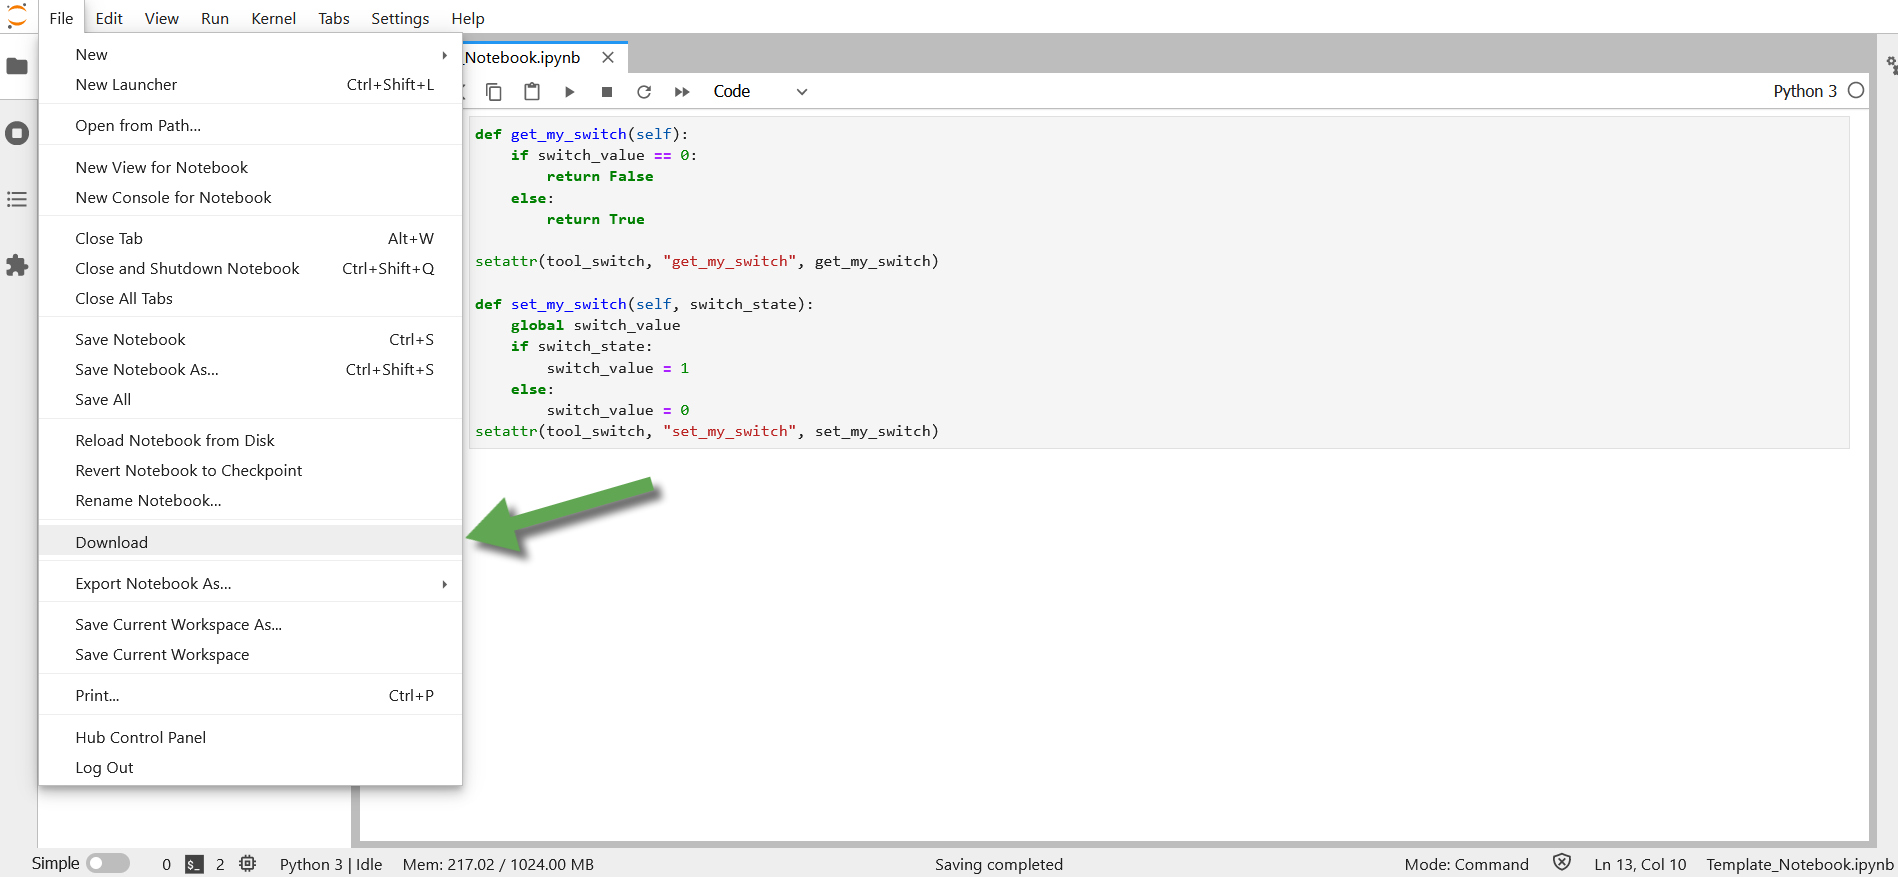
7 Downloading the Project Notebook
Before you download the Project Notebook, make sure to save it by clicking on the save icon at the top.
In the top bar, click on "File" and then on "Download" to download the Project Notebook.
8 Uploading the Project Notebook to MoLöwe
Upload the Project Notebook to MoLöwe by following the steps in the Notebook Chapter.