House Data Visualization
Prerequisite: You need to install our moloewe_chart package from moloewe_chart.zip.
To do this:
- Open a terminal in the directory which contains
moloewe_chart.zip - Activate your current working virtual environment
- Install the package using the command
pip install --user moloewe_chart.zip
For this example, we will be working with house-prices.csv dataset. Let's check it out.
import pandas as pd
local_path = 'D:/codes/leuphana-work/molowe/data/'
house_data = pd.read_csv(local_path + "house-prices.csv")
house_data.head()
| Unnamed: 0 | price | lotsize | bedrooms | bathrooms | stories | driveway | recreation | fullbase | gasheat | aircon | garage | prefer |
|---|---|---|---|---|---|---|---|---|---|---|---|---|
| 0 | 1 | 42000.0 | 5850 | 3 | 1 | 2 | yes | no | yes | no | no | 1 |
| 1 | 2 | 38500.0 | 4000 | 2 | 1 | 1 | yes | no | no | no | no | 0 |
| 2 | 3 | 49500.0 | 3060 | 3 | 1 | 1 | yes | no | no | no | no | 0 |
| 3 | 4 | 60500.0 | 6650 | 3 | 1 | 2 | yes | yes | no | no | no | 0 |
| 4 | 5 | 61000.0 | 6360 | 2 | 1 | 1 | yes | no | no | no | no | 0 |
1 Coming up with concept (separately from MoLöwe notebook)
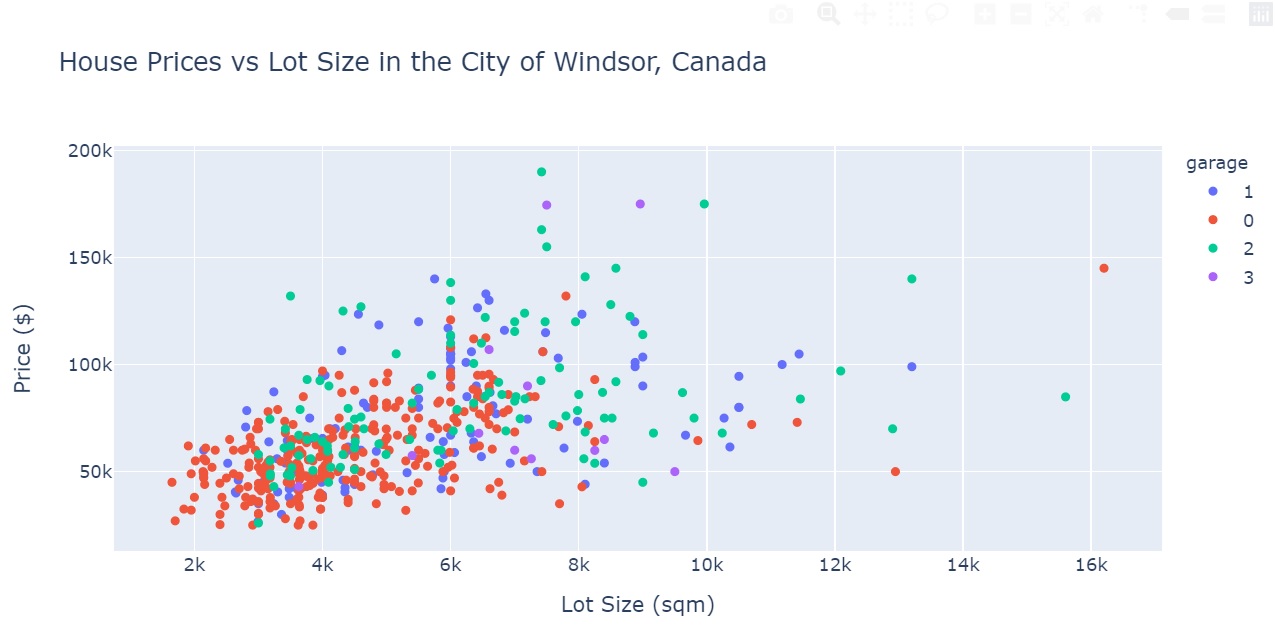
In this example, we would like to visualize the relationship between the house prices vs lot sizes and use color to indicate the number of garages a particular house has.
This part we can build independently outside the MoLöwe notebook, and later we can copy the codes back to the notebook and modify some places.
Determine the static part of the plot
This would be the static part of the plot, i.e. the part that stay the same and is not affected by the dropdown list. You can comfortably create a graph like below
import plotly.express as px

# Because the number of garage in the data is continuous, we convert it to discreet
# for the plot
house_data["garage"] = house_data["garage"].astype(str)

# Create the scatter plot
f = px.scatter(house_data, x = "lotsize", y = "price",
                color = "garage",
                title="House Prices vs Lot Size in the City of Windsor, Canada")

# Change the axis labels
f.update_layout(xaxis_title = "Lot Size (sqm)",
                yaxis_title = "Price ($)")

# we define chart configuration settings for Plotly (Plotly offers a config parameter)
    # in this case we try to set the ModeBar to inactive (not all options are available for Plotly in Python when exporting)
Determine the "interactive" part of the plot
From the above plot, we now want to dive deeper and visualize the relationship between the house prices vs lot sizes with a FILTER - the different numbers of bedrooms. Therefore, the information about the numbers of bedrooms is now our moving part of the plot, and is flowing into the dropdown list we are now building. I try breaking it down into the following steps:
1. Get one possible value for your dropdown list as a placeholder and build an initial plot
We need a starting point to build a plot. Therefore, it is advisable to use one possible value of the dropdown list and combine it with the static part to create your first plot. This would be the skeleton to your final plot when you combine it with the information from the dropdown list.
house_data["bedrooms"].unique()

array([3, 2, 4, 1, 5, 6], dtype=int64)
After looking at the unique values for bedroom number, I just choose a value, here I chose 2 as a placeholder. Now I build the "skeleton":
import plotly.express as px

house_data = pd.read_csv("data/house-prices.csv")

# Now we can subset houses which have 2 bedrooms
df_bedroom = house_data[house_data["bedrooms"] == 2]

# Because the number of garage in the data is continuous, we convert it to discreet for the plot
df_bedroom["garage"] = df_bedroom["garage"].astype(str)

# Create the scatter plot (with adjusted title)
f = px.scatter(df_bedroom, x = "lotsize", y = "price",
                color = "garage",
                title="House Prices vs Lot Size in the City of Windsor, Canada - " + str(2) + " bedroom(s)")

# Change the axis labels
f.update_layout(xaxis_title = "Lot Size (sqm)",
                yaxis_title = "Price ($)")

# we define chart configuration settings for Plotly (Plotly offers a config parameter)
    # in this case we try to set the ModeBar to inactive (not all options are available for Plotly in Python when exporting
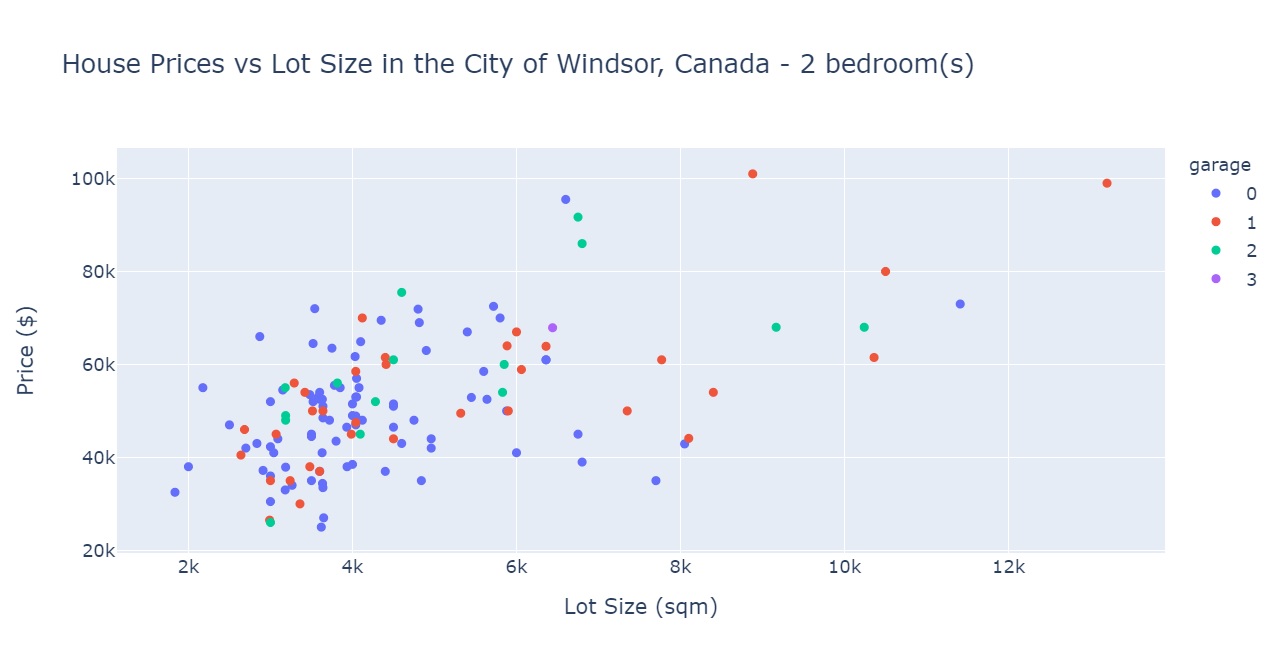
Now what you are seeing is a "version" of your interactive plot, that is the plot you would get when you select the value 2 from the dropdown list.
This is also a good time for you to fine-tuning your plot, adding titles and labels, checking the size, working the legend, etc. anything and involves the static part of your plot.
2. Get all possible values for your dropdown list
Now that we have the "skeleton" of your interactive plot in place, let's make the dropdown happen.
First, we need to check out all the possible values to be displayed in the dropdown list under a variable. Here, we extract all the unique values of the column bedrooms, and warp it in a list comprehension to produce a python list. We also sort the list, so the output would make more sense when being incorporated into the dropdown list.
# Get all possible values your dropdown.md list
bedroom_number = [i for i in house_data["bedrooms"].unique()]
bedroom_number.sort()
print(bedroom_number)
[1, 2, 3, 4, 5, 6]
And this is all you need to prepare before modifying the dropdown list function in the MoLöwe notebook.
2 Working in the MoLöwe notebook
Now we write code that is actually going into the MoLöwe notebook.
IMPORTANT NOTE: in order for things to run in MoLöwe, everything has to warped inside a function.
The following cells are essential codes for MoLöwe to function, they must be included everytime we write a MoLöwe notebook. They are included in the notebook template. We can leave most of them as is.
What we should change, for example, is the mapbox_access_token. For a project working with MoLöwe using map data, one can obtain this by signing up on Openstreetmap and get one's own API Token.
Essential Code
Default Code
# MobileSolutionWorkshop / MobileLösungsWerkstatt initialization
# template notebook version 21-11-15

# This section contains default code for the MobileSolutionWorkshop / MobileLösungsWerkstatt to work.
# Please do not modify.

class Moloewe:
    # create paths to the assets of the project
    def project_initialize(self, project_data):

        # folder with data files (GIS, CSV, POI, etc.) within the project
        # used by functions by the researcher to store data for calculations, data filtering, maps, graphs, etc.
        global data
        data = project_data['folder_project_data']

        # folder with images (JPG, PNG, SVG, PDF, GIF) within the project
        # used by tools (Image, Slideshow) and by the researcher
        global image
        image = project_data['folder_project_image']

        # folder with text files (TXT (utf-8), MD, HTML) within the project
        # used by tools (TextBox) and by the researcher
        global text
        text = project_data['folder_project_text']

        # folder with videos within the project
        # used by tools (Video)
        global video
        video = project_data['folder_project_video']

        # folder with output created within the project
        # used by functions by the researcher
        global output
        output = project_data['folder_project_output']
Import Modules
Here you can define all the imports of packages/modules you need for your notebook functions to work. The mandatory and basic packages are already included as well as suggestions for specific needs.
Feel free to add yours.
## basic packages for working with moloewe chart
#from moloewe_chart import MoloeweChart # for tool_graph


## basic packages for working with Plotly
import plotly.express as px # for tool_graph with Plotly
import plotly.graph_objs as go # for tool_graph with Plotly


## basic packages for working with data
import json as json # for loading and converting JSON data sets
import numpy as np # for converting data sets
from numpy import arange, array, ones # for converting data sets
import pandas as pd # for loading and converting data sets
from datetime import datetime # for converting data sets


## packages from Scikit-learn for machine learning
#from scipy import stats
#from sklearn import datasets, linear_model
#from sklearn.linear_model import LinearRegression
#from sklearn.model_selection import train_test_split
#from sklearn.metrics import mean_squared_error as mse
#from sklearn.metrics import r2_score
#from sklearn.linear_model import Ridge

## packages for network analysis and visualization

#import networkx as nx


## packages for visualizations

# Matplotlib
import matplotlib
import matplotlib.pyplot as plt
import matplotlib.patches as mpatches

# Plotly
import plotly.figure_factory as ff
from plotly.offline import (
    download_plotlyjs,
    init_notebook_mode,
    plot,
    iplot,
)


## miscellaneous packages

#init_notebook_mode(connected=True)
#import geopandas as gpd
#import shapefile as shp
Access Tokens and API Keys
# This token is for the Mapbox service for an interactive chart
mapbox_access_token = "pk.eyJ1IjoibW9sb2V3ZSIsImEiOiJjanprMzFkODUwMnJyM29vM3lwYWNwMG5jIn0.ElIGswv7z_KNHyivxm9yrg"
Definition of tools for global use
In this section you can define the interactive tools if they are used repeatedly throughout the presentation.
Tool Switch
Here you can define the class tool_switch.
For this tool work, you need a set_ and a get_ function for each switch button. You can find examples in MoLöwe documentation.
class tool_switch:

    pass
Tool Dropdown
Here you can define the class tool_dropdown.
For this tool work, you need a set_ and a get_ function for each dropdown list. You can find examples in MoLöwe documentation.
class tool_dropdown:

    pass
Tool Button
Here you can define the class tool_button.
For this tool work, you only need a set_ function for each button. You can find examples in MoLöwe documentation.
class tool_button:

    pass
Tool Slider
Here you can define the class tool_slider.
For this tool work, you need a set_ and get_ function for each slider. You can find examples in MoLöwe documentation.
class tool_slider:

    pass
Tool Map
Here you can define the class tool_map.
For this tool work, you need a get_ function for each button. You can find examples in MoLöwe documentation.
class tool_map:

    pass
Tool Graph
Here you can define the class tool_graph.
For this tool work, you need a get_ function for each graph/plot. You can find examples in MoLöwe documentation.
class tool_graph:

    pass
Create functions and global variables
There are different tools and interactive objects in MoLöwe, each is define as a Class. For this example we only need two things: an instance from Class tool_dropdown (for our dropdown list) and an instance from tool_graph (to display the plot).
Let's start by setting up our bedroom number dropdown.
Create a global variable
The first step is to create two global variables, one contains all possible values for a dropdown, and one contains the selected values. The selected value we set now in this initialization phase will be the default value for the plot. For now, we just copy the values we saw before and feed it in the bedroom_number_all variable. (Sidenote: we can actually make these variable dynamic by loading them directly from the data, but that adds another layer of explanation, so for now I just do this manually. Once you get the logic of MoLöwe, it would be easier to then try this alternative out).
# Get all possible values your dropdown.md list
global bedroom_number_all
bedroom_number_all = [1, 2, 3, 4, 5, 6]

# Set global variables with default
global bedroom_number_selected
bedroom_number_selected = 1
Setting up functions for a dropdown in tool_dropdown
For one instance of a dropdown, we have to write two functions: a get_ and a set_ function
get_function sets up and initializes the dropdown valuesset_function runs in the background everytime we interact with the dropdown list in presentation mode and choose a value, so that value can in turn be used in e.g. plotting.These functions must be appended to the class
tool_dropdownusingsetattr().
Now onto our example, we would set up a get_bedroom_number function to initialize the dropdown list. It needs two things:
- (1) all of the possible values we want to choose from
- (2) the default value, i.e. which value is displayed in the dropdown and also fed to the plot the moment we start the presentation
# Define get function
def get_bedroom_number(self): # here you put the function name
    return {
        "values": bedroom_number_all, # all the possible values (saved in bedroom_number)
        "default": bedroom_number_selected, # the default value (saved in bedroom_number_selected)
    }

# Append the function to class tool_dropdown
setattr(tool_dropdown, "get_bedroom_number", get_bedroom_number)
Now we set up the function set_bedroom_number. This function allows you to change the variable bedroom_number_selected based on what you are selecting in the dropdown (dropdown_selection). There is nothing much to modifying here, just name the function and call the right global variable:
# Define set function
def set_bedroom_number(self, dropdown_selection):  # here you put the function name
    global bedroom_number_selected # here you call the global variable
    bedroom_number_selected = dropdown_selection # assign the variable as the selected dropdown.md content

# Append the function to class tool_dropdown
setattr(tool_dropdown, "set_bedroom_number", set_bedroom_number)
Modify the plot code and put it into tool_graph
After creating our interactive part - the dropdown list - we now incorporate this into our static plot to obtain our plotting function in class tool_graph.
Regarding the class tool_graph, we only need to build one function for each of the plot created. Here I will create function get_houseprice_chart
Essentially, we copy the "skeleton" code we created before here, and where placeholder (2) was, we replace it with the variable bedroom_number_selected. There are some other things that just need to be there as MoLöwe structure:
- Load MoLöwe package with
from moloewe_chart import MoloeweChart - Initialize instance of MoloeweChart with
my_chart = MoloeweChart() - Get the directory to the asset folder
dataon the server and load our dataset from there - Add plot to this instance using the method
moloewe_chart_plotand return it in the end
Basically in the example below, my_chart receives plotting information as a dictionary from the plot f (f is an instance of Ploty Express)
def get_houseprice_chart(self):

    # Load MoLöwe package
    from moloewe_chart import MoloeweChart

    # Load othe necessary packages (here Plotly Express)
    import plotly.express as px

    # Initialize instance of MoloeweChart
    my_chart = MoloeweChart()

    # We call the selected variable (passed from the dropdown.md)
    global bedroom_number_selected

    # Load data (this global variable data contains the directory to our asset folder "data" on the server, where we upload house-prices.csv)
    global data
    house_data = pd.read_csv(data + "house-prices.csv")

    # Now we subset the data based on the dropdown.md value
    # We replace the value we chose earlier (2) with bedroom_number_selected
    df_bedroom = house_data[house_data["bedrooms"] == bedroom_number_selected]

    # Because the number of garage in the data is continuous, we convert it to discreet
    # for the plot
    df_bedroom["garage"] = df_bedroom["garage"].astype(str)

    # Create the scatter plot (with adjusted title)
    f = px.scatter(df_bedroom, x = "lotsize", y = "price",
                   color = "garage",
                   title="House Prices vs Lot Size in the City of Windsor, Canada - " + str(bedroom_number_selected) + " bedroom(s)")

    # Change the axis labels
    f.update_layout(xaxis_title = "Lot Size (sqm)",
                    yaxis_title = "Price ($)")

    # Optional, we can add some additional configs to the plot. If not, just create an empty dictionary
    my_config = dict()

    # Now we only need to return this method moloewe_chart_plot
    return my_chart.moloewe_chart_plot(plotly_data = f.to_dict(), plotly_config = my_config)


# Append the function to class tool_graph
setattr(tool_graph, "get_houseprice_chart", get_houseprice_chart)
Testing the code directly in this IDE using MoLöwe built-in function
Here, we initialize the MoLöwe project locally to test out the above functions directly in this IDE without having to upload the notebook onto MoLöwe. This saves us time and effort, and ensures us catching all coding-related mistakes before running the notebook on the MoLöwe server.
In the following cell, you only need to change the variable local_path. Remember to create all 5 asset folders - data, image, text, video, output - within this path as well, then put the house_price.csv file in data subfolder.
IMPORTANT: MAKE SURE to comment out this entire section before saving the notebook and uploading it onto MoLöwe
from moloewe_chart import MoloeweChart

def initialize_local_testing(local_data_path):

    project_data = {
            'folder_project_data': local_data_path + '/data/',
            'folder_project_image': local_data_path + '/image/',
            'folder_project_text': local_data_path + '/text/',
            'folder_project_video': local_data_path + '/video/',
            'folder_project_output': local_data_path + '/output/'
        }
    return project_data

# Load local path (you need to create all 5 asset folders - data, image, text, video, output - within this path as well, then put the .csv file in data)

local_path = 'D:/codes/leuphana-work/molowe'

# project_data = initialize_local_testing('E:/projects/molowe') # Chan's laptop
project_data = initialize_local_testing(local_path) # Chan's workstation

# Initialize Moloewe() instance
local_testing = Moloewe().project_initialize(project_data)

# Initialize all testing objects
plot_test = MoloeweChart()
tool_map_test = tool_map()
tool_graph_test = tool_graph()
tool_switch_test = tool_switch()
tool_dropdown_test = tool_dropdown()
tool_slider_test = tool_slider()
Now you can check all the functions we wrote above. They show you all the possible values within the dropdown bedroom number, the currently selected value, and the corresponding plot with that value. You can go back and try selecting another bedroom number, then call the moloewe_plot_preview function to see the change in plot.
# Check all values contained in the dropdown.md bedroom number
tool_dropdown_test.get_bedroom_number()
{'values': [1, 2, 3, 4, 5, 6], 'default': 1}
# Set desired bedroom number
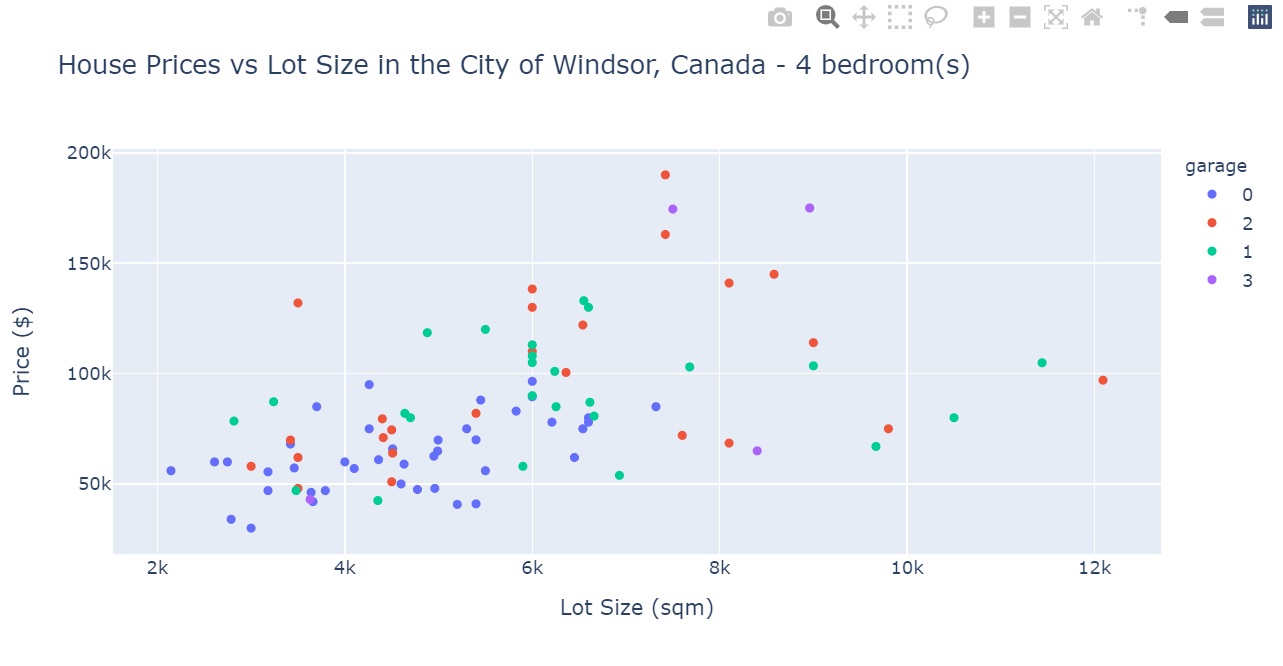
tool_dropdown_test.set_bedroom_number(4)
# Plot with selected bedroom number
plot_test.moloewe_plot_preview(tool_graph_test.get_houseprice_chart())
Hopefully, with this example, you could gain a better insight of the MoLöwe logic. To sum up, interaction with MoLöwe charts & maps can be done with the following steps:
- Come up with a concept of what you are trying to visualise (plot, map)
- Determine with part of that visualization would be your static part, and what would then be your "interactive" component
- Build the static part of the visualization
- Select any out of the possible values of the "interactive" component to be the placeholder
- Build this placeholder into the visualization to get a "skeleton version" of how the interactive visualization would look like, when a certain value from the interactive component is selected.
- Build
setandgetfunctions for the corresponding MoLöwe interactive tool you would like to use (we havetool_switch,tool_dropdown,tool_sliderfor this) - Build
getfunction for the visualization (either withtool_graphortool_map): combining the skeleton map and the selected value from thesetfunction