Graph
A Graph Tool is used to display a Plotly graph or Echarts graph during a presentation. Additionally, it supports input from other tools such as Dropdown Tool and Slider Tool.
The Graph tool requires definition of a function on the Project Notebook.
See here on how to set up the Graph Tool in the Project Notebook.
Placing Graph on a Slide (Edit Mode)
To place a Graph Tool on a Slide, first define the Graph Tool on the Project Notebook and upload the notebook to MoLöwe. Then, open the slide in which the Graph Tool needs to be placed in Edit Mode.
Then, open the tool selection panel in Edit Mode on the page that you want to place the tool in by following steps outlined here.
Following that, click on the Graph icon (signified by a bar chart).
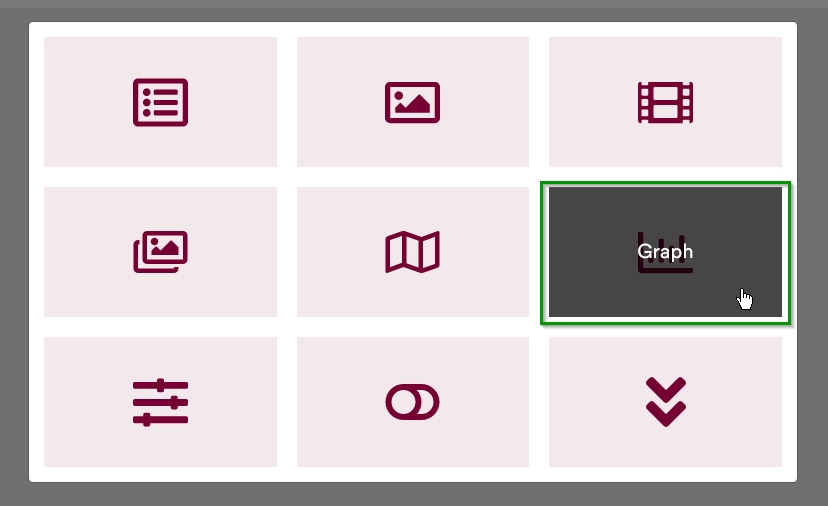
This will place a container for the Graph Tool onto the slide.
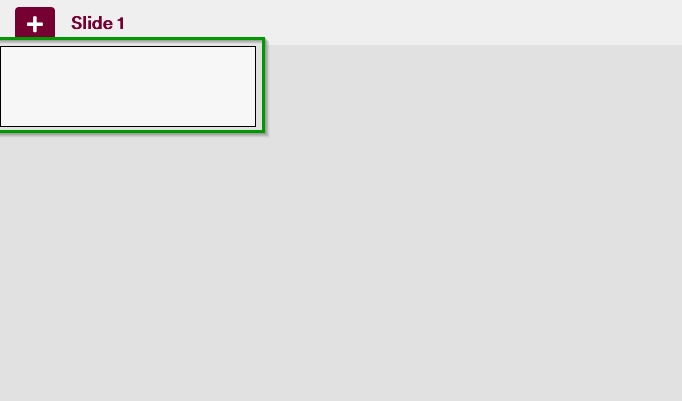
When a user hovers over this container, they will be presented with a gear icon that they can click on.

Clicking on this icon opens an interface that allows users to select the graph that they want to add to the slide.
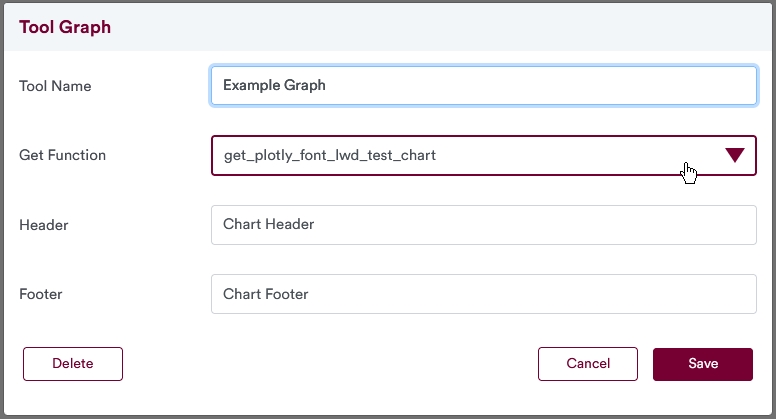
The required fields in this interface are Tool Name and Get Function. The Tool Name is a unique identifier for the tool, whereas the Get Function is a function that is defined in the Project Notebook. The Header and Footer text are optional.
When the Tool Name and Get Functions have been set/selected, users can click on the "Save" button. Then, users are taken back to the slide in Edit Mode.
They can then resize and reposition the size of the tool on the Slide canvas as described here.
The Graph might not render properly when in Edit Mode. However, when in Presentation Mode or in Controller Mode, provided that there are no errors in the code in the Project Notebook, the Graph will render properly to fill the container that it is placed in.
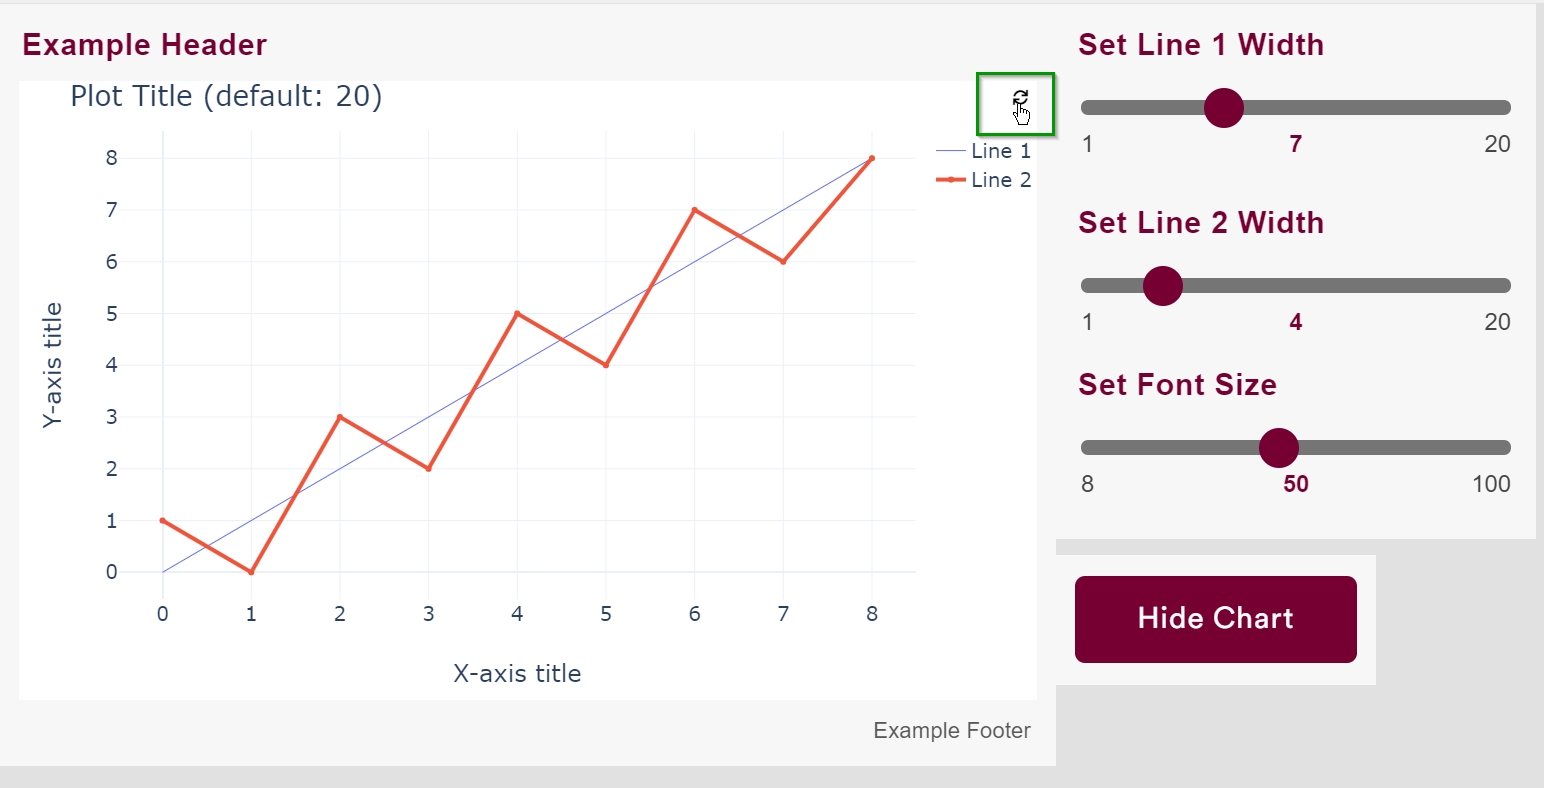
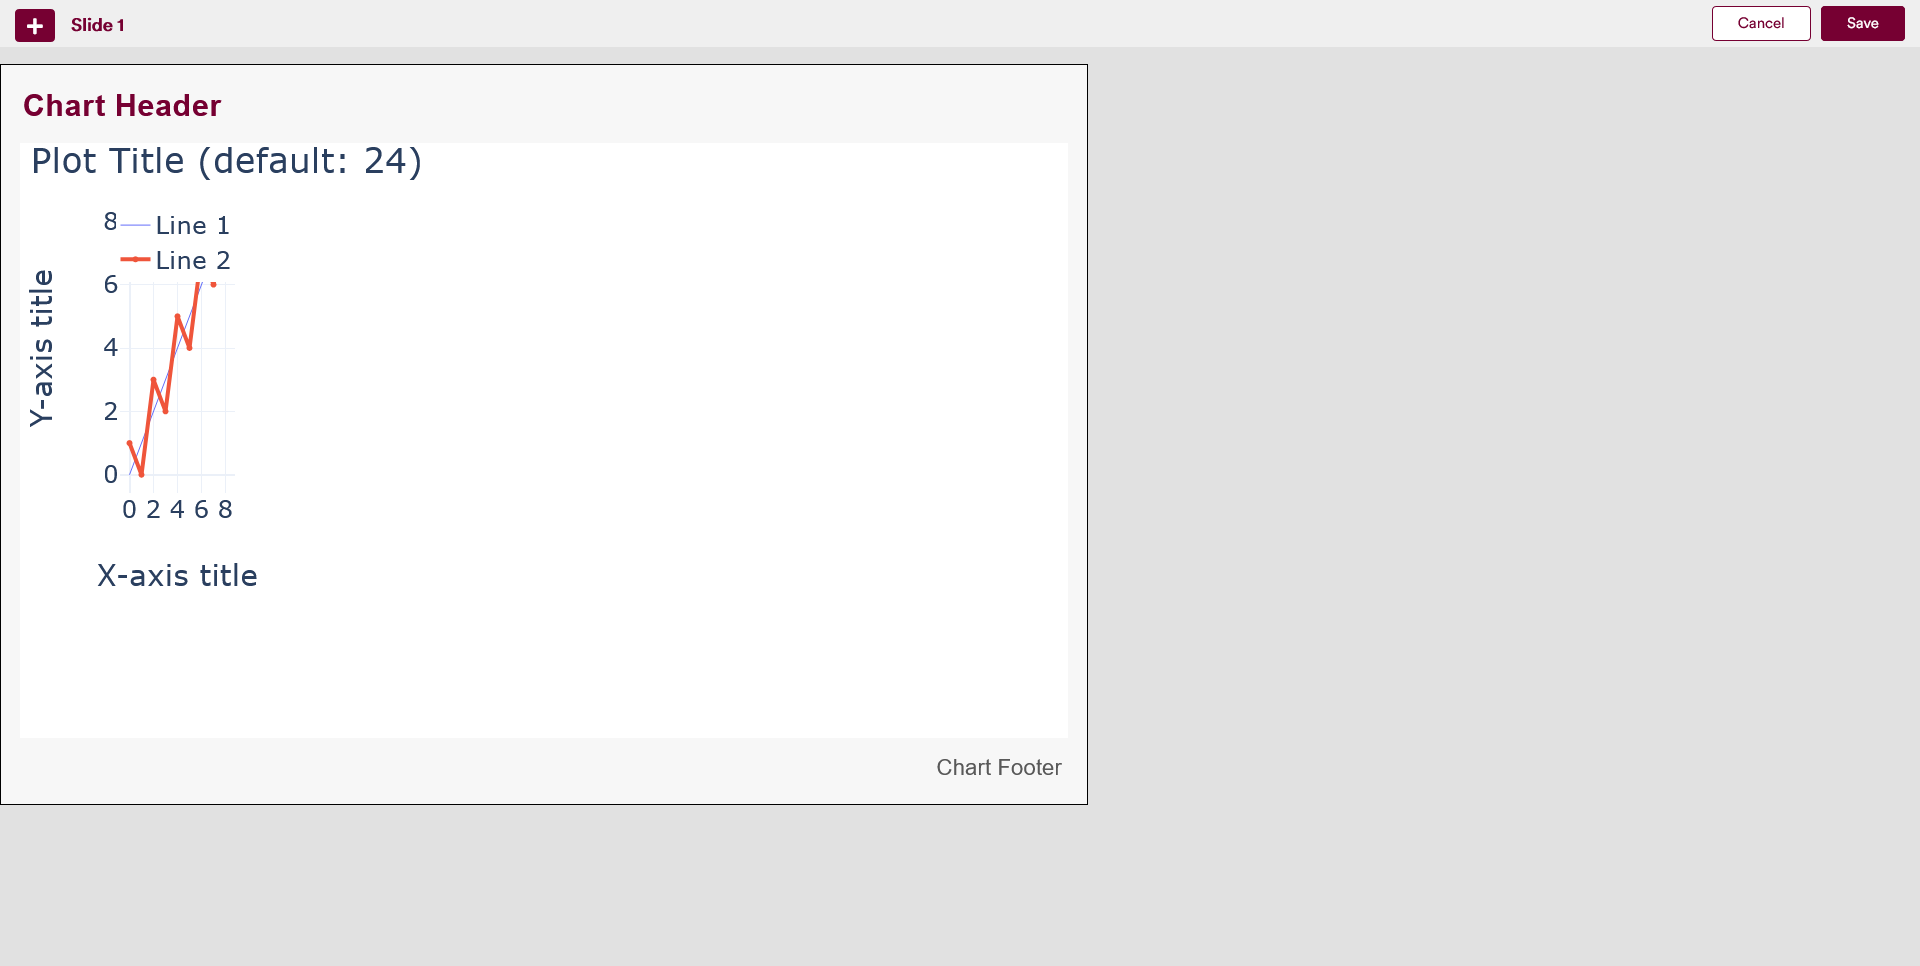
In case of this example, the resized chart that has been placed in the slide looks like the following.
Viewing a Graph during Presentation
During presentation (i.e. while at Presentation Mode or Controller Mode), users can view the Graph tool that was defined in the Edit Mode using the steps described above.
Combining Graphs with Other Tools
A graph defined using the Graph tool can be manipulated by using other MoLöwe tools that allow users to select/change values (eg. Dropdown tool). The general order of operation to achieve this is as follows:
- Define all the interactive tools necessary in the Project Notebook.
- Define the Graph in the Project Notebook as described above. The global variables that correspond to the different interactive tools from Step 1 also need to be called within this function in order for them to be used.
- Place the different interactive tools on a slide in Edit Mode.
- Place the Graph Tool on a slide in Edit Mode.
- Resize and/or reposition the tools as necessary.
- Save the Slide and exit Edit Mode.
- Start a presentation (Presentation Mode or Controller Mode) and open the slide.
- Use interactive tools (Range Slider, Button, Dropdown Tool, etc.) to change different values.
- Refresh the graph as described below.
When a Graph can be manipulated using other interactive tools (e.g. Dropdown and Slider as mentioned above), after making changes using these interactive tools, the graph needs to be refreshed manually by clicking on an icon that appears on the top right of the Graph's container as shown below. The refresh function works only when the slide is being viewed in the Controller or Presentation Modes.